Run & extract · No. 31
Aspire: one command brings up the whole distributed app
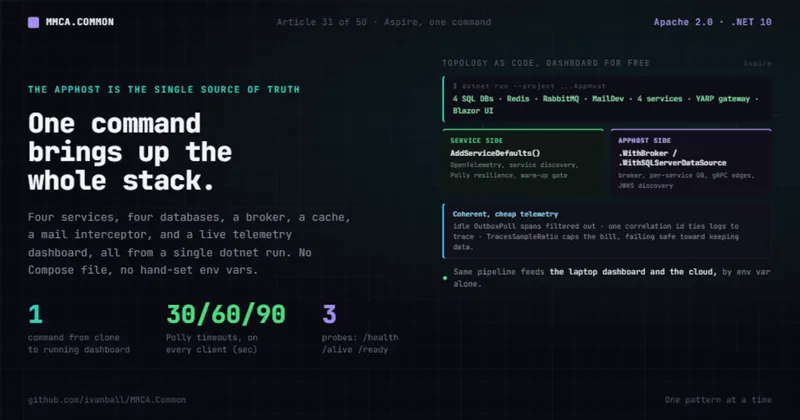
Four service processes, four databases, a broker, a cache, a mail interceptor, and a
live telemetry dashboard, all from a single dotnet run. Here is how MMCA.Common wires that with
.NET Aspire, step by step.
Spinning up a distributed system on a laptop is usually where good intentions go to die. You need SQL Server, a message broker, maybe Redis, a way to read the emails the app sends, and the four service processes themselves. Each one wants a connection string, a port, and an environment variable, and the README that explains the order to start them in is always a little out of date.
The result is the worst kind of friction: a new engineer spends a day getting the stack to boot, and even then "works on my machine" hides a topology that does not match production. Integration bugs wait until CI, or worse, until a deploy.
This tutorial walks the other path. With .NET Aspire and the two MMCA.Common.Aspire* packages, the
whole distributed application is declared once as code, and one command brings it up with a dashboard
showing live logs, metrics, and traces from every process. We will go from a clone to a running
dashboard, and then look at exactly what the framework wired for you.
Prerequisites
You need a few things in place before the first run:
- .NET 10 SDK (the framework targets .NET 10.0 with C#
previewlanguage features). - Docker (or a compatible container runtime) running locally. Aspire provisions SQL Server, Redis, RabbitMQ, and a mail interceptor as containers.
- An app that consumes MMCA.Common. You can scaffold one in a command
(
dotnet new install MMCA.Templatesthendotnet new mmca-app -n Your.App), which generates an AppHost wired to SQL Server plus an API and a Blazor UI. Or clone one of the two reference consumers, MMCA.ADC (the Atlanta Developers Conference app) and MMCA.Store (e-commerce). The walkthrough below uses ADC's topology because it is the fuller example: four services, a gateway, and a UI. A scaffolded app starts at the monolith end of that spectrum and grows into it.
The two framework packages that make this work:
MMCA.Common.Aspireis the service-side baseline. Every running process opts into it for OpenTelemetry, health checks, service discovery, HTTP resilience, and startup warm-up.MMCA.Common.Aspire.Hostingis the AppHost-side orchestration vocabulary. It exports the fluent helpers that wire the broker, JWKS discovery, and per-service databases.
They are deliberately separate assemblies so a running service never drags in the full Aspire.Hosting
tooling graph (the doc comment on the hosting package spells this out).
Step 1: run the whole stack with one command
From the consumer repo, the entire local topology comes up with:
# From MMCA.ADC/ (or MMCA.Store/)
dotnet run --project Source/Hosting/MMCA.ADC.AppHost
That single command brings up everything the application needs locally: four SQL Server databases, Redis, RabbitMQ with its management UI, a MailDev SMTP interceptor, four extracted microservice processes, a YARP gateway pinned to https://localhost:6001, and the Blazor UI pinned to https://localhost:6002. The Aspire dashboard opens automatically and shows live logs, metrics, and distributed traces from every process via an OTLP endpoint it injects into each one.
No Docker Compose file is needed. No environment variables need to be set by hand. The AppHost is the single source of truth for the local topology.
A heads-up for headless or scripted runs: the AppHost wants an interactive console to launch the dashboard and the control plane. If you launch it from a background process it can stall at control-plane init. Run it interactively in a terminal you can watch.
Once it is up, the dashboard (the URL is printed in the console) is your control panel: every resource, its health, its logs, its traces, and links to the RabbitMQ management UI (http://localhost:15672) and the MailDev inbox (http://localhost:1080).
Step 2: understand what AddServiceDefaults() configured
Each service host calls one method first in its Program.cs, before anything app-specific:
// In each service's Program.cs (representative shape)
var builder = WebApplication.CreateBuilder(args);
builder.AddServiceDefaults();   // from MMCA.Common.Aspire
// ... app-specific registration ...
var app = builder.Build();
app.MapDefaultEndpoints();      // health + liveness probes
AddServiceDefaults() is the service-side baseline, and it is identical across both consumer apps
because it lives in the framework, versioned in lockstep, with no per-app copy to drift. It configures
three things you would otherwise hand-roll:
- OpenTelemetry for logging, metrics, and tracing. Logs include the formatted message and scopes;
metrics always cover ASP.NET Core, and cover
HttpClientand the .NET runtime unless a host turns those cost knobs off (Step 6); tracing instruments ASP.NET Core andHttpClientand subscribes four activity sources: the application's own,MMCA.Common.Outbox,MMCA.Common.InternalCommands, andMMCA.Common.AI. It also registers nine MMCA-specific meters by literal name:MMCA.Common.Outbox(a dead-letter counter, a processed counter, a dispatch-lag histogram, and a pending-depth gauge),MMCA.Common.Cqrs(RED histograms for command and query handlers, plus query cache hit and miss),MMCA.Common.Idempotency(the idempotency filter's replay, conflict, and degraded counters),MMCA.Common.Scheduler(the recurring scheduler's run outcomes, duration, and schedule lag, inert in a host that never turnsScheduler:Enabledon),MMCA.Common.Broker(the broker transport's consumer faults plus outbox circuit-breaker openings, inert in a host that stays on the in-process bus),MMCA.Common.OutputCache(the output-cache eviction consumer's failed tag evictions),MMCA.Common.BestEffort(the swallowed failures of best-effort side effects),MMCA.Common.InternalCommands(the durable internal-command runner), andMMCA.Common.AI(the optional AI package's token spend and call duration, inert until a host adds that package and enablesAi:Enabled). Polly's ownPollymeter is subscribed alongside them, so retries, timeouts, and circuit transitions leave the process instead of looking like plain latency from the outside. - Service discovery, so a service resolves a peer by name (http://identity, http://conference) rather than a hardcoded address.
- Polly resilience handlers on every
HttpClient: a 30 second per-attempt timeout, a 60 second circuit-breaker sampling window, and a 90 second total-request timeout. Every outbound call rides this pipeline by default (this is the runtime side of ADR-009).
It also installs a SocketsHttpHandler tuned for Azure Container Apps and a startup warm-up gate (the
gate is covered in Step 3, the handler in Step 7). The point of Step 2 is simply this: the moment a
service calls AddServiceDefaults(), it has production-grade telemetry and resilience without writing any
of it.
Step 3: read the health endpoints from MapDefaultEndpoints()
MapDefaultEndpoints() exposes the probe surface your platform reads:
/healthruns all registered checks. This is the one for humans and dashboards. It is served throughMapCachedHealthChecks, a short-TTL single-flight cache, so an anonymous flood on a path that sits on the rate-limit bypass costs one probe round per window rather than one per request./aliveis the liveness probe. It runs only the"live"-tagged "self" check, so a transient dependency outage (SQL Server briefly down, say) does not mark the process dead and get it killed and restarted. It is deliberately left uncached./health/readyis the readiness probe, behind the same cache as/health. It reports unhealthy until the warm-up gate opens, so the platform holds traffic off a replica that is still cold, and its predicate excludes both theLiveand theOptionaltags. A dependency the app degrades gracefully without (a distributed cache behind an in-memory fallback, a broker behind a retrying outbox) must not gate readiness: making it readiness-fatal takes every replica out of rotation at once and turns a partial degradation into a total outage. Those checks still surface on/health.
That split matters. A liveness probe that fails on a downstream outage produces a restart storm; a readiness probe that ignores cold-start produces slow, failing first requests. Separating the two is the difference between a system that rides out a blip and one that amplifies it.
The warm-up gate behind /health/ready runs IWarmupTask implementations once at startup, then opens.
The built-in task, OpenIdConnectMetadataWarmupTask, pre-fetches the OIDC discovery document so the
first authenticated request does not pay a cold connection on a CPU-throttled idle replica (the classic
"first request fails, second succeeds" pattern). Failures are logged but never wedge the gate shut.
Step 4: see how the AppHost wires the distributed app
The AppHost Program.cs does not start anything immediately. It builds a resource model: a graph of
containers, databases, services, the gateway, and the UI, with their dependency edges. The cross-cutting
wiring vocabulary lives in MMCA.Common.Aspire.Hosting as twelve fluent helpers (thirteen methods,
because WithBroker has one overload per broker resource). Here is the shape of a service declaration
(representative, condensed from ADC's AppHost):
// Representative: one service host, fully wired
builder.AddProject<Projects.MMCA_ADC_Conference_Service>("conference", launchProfileName: "https")
    .WithSQLServerDataSource(conferenceDb, "Conference")   // per-service database (ADR-006)
    .WithReference(redis)                          // distributed cache
    .WithBroker(rabbit)                            // RabbitMQ + MessageBus__Provider=RabbitMq
    .WaitFor(redis)
    .WaitFor(mailDev)
    .WithH2cHealthCheck()                          // liveness over the HTTP/2 cleartext endpoint
    .WithExternalHttpEndpoints();
What each framework helper does:
AddMessageBroker()wrapsbuilder.AddRabbitMQ(name).WithManagementPlugin(). One call provisions the broker container with its admin UI.AddServiceBusEmulatorBroker()is its peer for the official Azure Service Bus emulator, so the local topology can stand up either transport. In production the same projects point at Azure Service Bus by config alone, with no AppHost change.WithBroker(rabbit)chains.WithReference(broker).WaitFor(broker)and setsMessageBus__Provider=RabbitMq. That environment variable is what the service'sAddBrokerMessagingreads to select the RabbitMQ transport over the in-process bus. When the variable is absent (for example in integration tests), messaging short-circuits to in-process, so tests need no real broker. The Service Bus emulator overload is the same shape one resource type over: it setsMessageBus__Provider=AzureServiceBusplus the emulator's connection string and admin endpoint.WithSQLServerDataSource(db, "Conference")is the AppHost face of database-per-service (ADR-006). (The package also shipsWithPostgreSQLDataSource,WithCosmosDataSource, andWithSqliteDataSourcefor the polyglot engines in ADR-018.) In one chain it references the database, waits for it to be healthy, and injects exactly one connection-string environment variable, the multi-source routing layer'sDataSources__Conference__SQLServerConnectionString. That one entry is the whole configuration: with no top-level connection string, the single database a host declares this way also becomes itsDefaultsource, so the framework's own tables and the readiness health check land on it too, and each service runs as a clean single-database monolith with one change tracker and one migration set, while still owning its ownOutboxMessagestable.
Step 5: wire the extraction points (gRPC and JWKS)
The same AppHost wires the extraction boundaries that make the modular monolith behave like real microservices: typed gRPC clients and cross-service auth.
gRPC references are declared as directed edges, only where a real call exists:
// Representative: only actual call edges are declared
notificationService.WithReference(identityService).WaitFor(identityService);
engagementService.WithReference(conferenceService).WaitFor(conferenceService);
conferenceService.WithReference(engagementService);   // reverse edge, deliberately no WaitFor
WithReference injects the services__{name}__http__0 discovery variables the consumer's
AddTypedGrpcClient<T>(serviceName) uses to resolve a peer. The deliberate asymmetry on the
Conference and Engagement pair avoids a circular WaitFor deadlock: transient "peer not ready" errors
during startup self-heal through the Polly pipeline baked into the typed client.
JWKS discovery is wired with one helper per consuming service:
notificationService.WithJwksDiscovery(identityService, gateway);
engagementService.WithJwksDiscovery(identityService, gateway);
conferenceService.WithJwksDiscovery(identityService, gateway);
WithJwksDiscovery sets Authentication__JwtBearer__Authority so each service validates RS256 tokens
against Identity's published keys, with no shared symmetric secret. The non-obvious part: it prefers the
gateway's HTTPS endpoint over Identity's. The services run HTTP/2-only on cleartext so gRPC can use
prior-knowledge negotiation, but the default JwtBearer backchannel HttpClient speaks HTTP/1.1, which
a Kestrel HTTP/2-only endpoint rejects. The gateway terminates TLS, speaks both protocols via ALPN, and
forwards the /.well-known/* fetch to Identity over h2c. The metadata fetch works end to end without
weakening any service (ADR-004 and ADR-008).
Step 6: make the telemetry coherent, and keep the bill down
There are a few more pieces worth knowing, because they shape what you see in the dashboard, and what
you pay for it. Start with the noise. The OutboxProcessor background service polls every relational
outbox table on a recurring cycle (high in production, for example 300 seconds, to cut idle work). Each
idle poll would otherwise generate an OutboxPoll span, plus, under the Azure Monitor distro, a child
SqlClient dependency span. At scale, those idle spans would dominate ingestion and clutter the
dashboard.
OutboxPollFilterProcessor (in the Aspire package) is an OpenTelemetry BaseProcessor<Activity> that
walks each ending span's parent chain and, for anything descended from the recurring OutboxPoll
activity, clears the Recorded flag so the batch exporters skip it. It is registered before the
exporters so its OnEnd runs first. Real per-message OutboxProcess spans use restored parent
contexts and are never poll descendants, so genuine outbox telemetry survives. The net effect: your
traces show real work, not idle polling, and your observability bill reflects that.
Idle polling is not the only chatter worth refusing. Health probes are the other, and they are bigger:
Container Apps liveness and readiness probes, the gateway's downstream aggregate probes, YARP active
health checks, and the availability web test account for the whole AppRequests stream in both
production workspaces, and their children (the health check's SELECT 1, the Redis PING, the gateway's
calls to each backend's /alive) for most of the dependency rows. Telemetry:FilterProbeTelemetry is
on by default, so ProbeTelemetryFilter refuses those request and outgoing spans at the
instrumentation options and ProbeTelemetryFilterProcessor un-records the dependency children that
were sampled independently. Metrics are left untouched on purpose, so probe traffic still shows up on
dashboards, just not in the trace bill. Three metric knobs sit next to it:
Telemetry:DisableHttpClientMetrics and Telemetry:DisableRuntimeMetrics each drop a whole meter
family through a View (a View, rather than simply skipping the instrumentation, because the Azure
Monitor distro adds those meters itself, which makes the toggle authoritative instead of advisory), and
Telemetry:EnablePollyDurationMetrics runs the other way: Polly's two duration histograms stay dropped
unless a host opts in, while its retry and circuit-breaker event counter always ships.
That filtering only matters because of where the telemetry actually flows, and the framework decides
that by environment, not by code. AddServiceDefaults() enables the OTLP exporter when
OTEL_EXPORTER_OTLP_ENDPOINT is set, which is exactly the variable the Aspire dashboard injects into
every process, so the dashboard on your laptop lights up with no configuration. It enables Azure Monitor
(through UseAzureMonitor) when APPLICATIONINSIGHTS_CONNECTION_STRING is set, which the cloud
deployment supplies, so production ships to workspace-based Application Insights instead. Both can run at
once, each shipping its own copy, so the same pipeline feeds the local dashboard and the cloud with no
code change between them.
A dashboard is only as readable as the trail through it, and one id ties that trail together.
CorrelationIdMiddleware reads an X-Correlation-ID header off each request; when the client sends
none, it falls back to the current W3C trace id, then to ASP.NET Core's TraceIdentifier. It sets that
id on a scoped ICorrelationContext and echoes it on the response header, and the CQRS logging
decorators stamp the same id into every log scope they open. So one id lines up a request's logs, its
response header, and its distributed trace: the first thing you reach for when a call that crossed the
gateway and three services goes wrong.
The last lever is the one a FinOps owner reaches for, because trace volume is the single largest
observability line item. Telemetry:TracesSampleRatio is unset by default, so a host keeps every trace
and behavior does not change. A deployed host sets a ratio in the open interval (0,1), for example 0.1
to keep one trace in ten, and the framework wraps a TraceIdRatioBasedSampler in a ParentBasedSampler
so a sampled-in request keeps its whole trace intact across service boundaries instead of being shredded
hop by hop. The fallback is deliberately biased toward data: a key that is absent, unparseable, or
outside (0,1) reverts to sampling everything, so a typo can raise the bill but can never silently drop
all telemetry.
Step 7: harden the response headers, and reuse connections
Two smaller pieces round out the baseline, and both are the kind of thing each host would otherwise hand-roll and drift on.
First, security headers at the host edge. Instead of each host independently setting X-Frame-Options,
Referrer-Policy, Permissions-Policy, HSTS, and a Content-Security-Policy (and slowly disagreeing as
they do), the framework ships the pair a host wires in two lines. AddCommonSecurityHeaders binds the
"SecurityHeaders" config section and registers the default CSP provider; UseCommonSecurityHeaders
inserts the SecurityHeadersMiddleware into the pipeline. Call both and a new host inherits hardened
defaults automatically, with per-host overrides through that config section.
The CSP comes from an ICspPolicyProvider: the framework ships a StaticCspPolicyProvider, and a host
that needs a dynamic policy (the Blazor web host does) registers its own. The policy travels as a
CspPolicy(Value, Enforce) record, so a provider can emit Content-Security-Policy to enforce, or
Content-Security-Policy-Report-Only to trial a tightened policy without breaking the page first. That
enforce-vs-report switch is the standard safe way to roll a CSP out.
Second, connection reuse. The SocketsHttpHandler that AddServiceDefaults() installs is tuned for
Azure Container Apps so outbound HTTP connections are reused across requests rather than reopened on a
consumption-plan platform, where idle reconnects cost both latency and CPU. It is the same "configure it
once in the shared baseline" move as everything else in this article: the tuning lives in the framework,
not copied into each Program.cs.
Step 8: refuse to boot on bad configuration
One command bringing the stack up is only useful if a misconfigured process says so immediately. A bad settings value can surface in two places. At first use, where a missing SMTP host becomes a 500 on the first password-reset mail and an unparseable outbox interval becomes a background loop that never drains, both on a replica that already passed its readiness probe and is taking live traffic. Or at boot, where the host refuses to start and the platform never routes to it. The framework picks boot (ADR-070).
Every settings section binds through one chain, and it is textually the same everywhere:
services.AddOptions<ConnectionStringSettings>()
    .Bind(configuration.GetSection(ConnectionStringSettings.SectionName))
    .ValidateDataAnnotations()
    .ValidateOnStart();
ValidateOnStart() is the load-bearing link. ValidateDataAnnotations() on its own defers evaluation to
the first resolution, which for a section only a background service reads can be minutes after the replica
started taking traffic; pairing the two converts "configured wrong" into "did not start". Twenty-three
framework sections bind this way (connection strings, SMTP, persistence, outbox, login protection, password
reset, refresh sessions, message bus, JWKS, cache, query-cache pipeline, scheduler, two-factor, email
confirmation, permission grants, audit trail, tenancy, push notifications, internal commands, idempotency,
JWT, the UI's API settings, and the Blazor host's CSP settings), including the ones behind opt-in features.
The two sections every host needs, ApplicationSettings and ModulesSettings, bind on the identical chain
inside the framework's module-host wiring, so a consuming app inherits them instead of repeating them and
adds only its module-level sections, such as Store's Stripe configuration.
Validation lives on the settings type, as data annotations extended by IValidatableObject where a rule
spans fields. JwtSettings marks Issuer and Audience required and then checks key material
conditionally on the selected algorithm: HS256 demands a secret of at least 32 characters, RS256 demands an
RSA private key. So a host configured for RS256 with no private key fails to boot rather than failing to
sign its first token.
The second half of the contract is uniformity. A section binds in exactly one place, on that one chain, and
is read through Microsoft.Extensions.Options at the point of consumption, so there is no second path by
which an unvalidated section can reach a handler. The exceptions are deliberate and say so at the call site.
OwnerOrAdminFilterOptions validates data annotations but skips ValidateOnStart, because its required
BypassRole has no default the framework could know (the framework knows no role names), so validating it
at startup would fail every host that never applies the filter; validating on first resolve puts the message
in front of the host that actually uses it. A small set of optional sections, the hybrid cache options,
native push, and file storage, binds without the validation chain for the same class of reason.
Trade-offs and gotchas, honestly
A single-command stack is a force multiplier, but it has edges worth naming:
- It wants Docker and an interactive console. No container runtime means no SQL, Redis, or broker. And the AppHost launched headless can stall at control-plane init; run it in a real terminal.
- Local broker is RabbitMQ by default; production is Azure Service Bus. The transport switch is
entirely environment-driven (
MessageBus__Provider), so no code path changes, but they are not the same product. Basic-tier Service Bus also lacks the topics MassTransit needs, so the production tier is Standard. ADC narrows the gap on demand:ADC_BROKER=servicebusswaps the official Azure Service Bus emulator in locally throughAddServiceBusEmulatorBroker. That costs a second container and a warm-up, which is why the everyday inner loop still runs on RabbitMQ. - MailDev is not a real SMTP relay. The mail interceptor is a local convenience; production uses a real relay and is not provisioned by Aspire. This is the one deliberate gap between local and cloud topology.
- Persistent containers keep state across runs. Aspire marks SQL, Redis, and RabbitMQ as persistent so you are not re-seeding on every restart. That is a feature, but it also means stale local data can outlive a schema change; reset the container when a migration changes shape.
- Telemetry meters are registered by literal name. Because the Aspire package has no project
reference to the assemblies that define
MMCA.Common.Outbox,MMCA.Common.Cqrs,MMCA.Common.Idempotency,MMCA.Common.Scheduler,MMCA.Common.Broker,MMCA.Common.OutputCache,MMCA.Common.BestEffort,MMCA.Common.InternalCommands, andMMCA.Common.AI(nor to Polly's own assemblies for thePollymeter), those source and meter names are duplicated string literals. Rename a source in one place and you must rename it in the other; the code comments flag this. - Nothing gates the fail-fast chain. No fitness test asserts that a new
AddOptions<T>call carriesValidateDataAnnotations().ValidateOnStart(). The uniformity in Step 8 is convention held by review, not an enforced gate, so a section added without the chain fails silently, which is to say it fails later. The related trade: bad configuration becomes a crash loop rather than a degraded start, which is the intended exchange but takes the whole rollout instead of one code path.
None of these are reasons to avoid Aspire. They are the reasons to know what the one command actually stood up.
Apply this even without MMCA
The pattern ports cleanly to any Aspire app:
- Put service defaults (telemetry, discovery, resilience) in one shared method every host calls, not copy-pasted per service. Drift between hosts is where observability gaps hide.
- Split liveness from readiness. Liveness ignores dependency outages; readiness gates on warm-up. Conflating them causes restart storms or slow first requests.
- Declare topology as code in the AppHost, with
WaitForedges only where a real dependency exists. The resource graph becomes the documentation. - Filter recurring background spans out of export. Idle polling at scale is a real line item.
- Validate configuration at startup, not at first use. Bind every section with
ValidateDataAnnotations().ValidateOnStart()so a misconfigured host never reaches the readiness gate and never takes traffic it cannot serve.
What we covered: how one dotnet run on the AppHost brings up the full distributed stack with a
live dashboard; what AddServiceDefaults() configures (OpenTelemetry, service discovery, Polly
resilience at 30s/60s/90s); what MapDefaultEndpoints() exposes (/health, /alive,
/health/ready); how the AppHost wires the broker, per-service databases, gRPC references, and JWKS
discovery through the MMCA.Common.Aspire.Hosting helpers; how OutboxPollFilterProcessor and the
probe-telemetry filter keep idle poll spans and health-probe traffic out of telemetry while
Telemetry:TracesSampleRatio and the three metric knobs cap ingestion cost with fail-safe defaults;
how CorrelationIdMiddleware ties a request's logs to its trace and the dual OTLP
plus Azure Monitor exporters feed the local dashboard and workspace-based Application Insights; how
AddCommonSecurityHeaders plus UseCommonSecurityHeaders and a tuned SocketsHttpHandler harden
responses and reuse connections from the same shared baseline; and how the fail-fast configuration
contract binds every settings section with ValidateDataAnnotations().ValidateOnStart() so a
misconfigured host refuses to boot instead of failing on its first request.
Next in the series: extracting a module out of the monolith into its own gRPC service, live, using the AppHost wiring you just met.
MMCA.Common is Apache-2.0 licensed and open source. Star the repo, read the Aspire chapter, or
dotnet add package MMCA.Common.API and try it.
- Repo: https://github.com/ivanball/MMCA.Common
- Packages:
MMCA.Common.Aspire(service defaults) andMMCA.Common.Aspire.Hosting(AppHost wiring).
Tags: .NET, C Sharp, Microservices, DevOps, Observability